require "charty"
require "datasets"
require "numo/narray"falserequire "charty"
require "datasets"
require "numo/narray"false{
charty: Charty::VERSION,
datasets: Datasets::VERSION,
numo_narray: Numo::NArray::VERSION
}{:charty=>"0.2.12", :datasets=>"0.1.7", :numo_narray=>"0.9.2.1"}Charty::Backends.use(:plotly):plotlypenguins = Datasets::Penguins.new
plot = Charty.scatter_plot(data: penguins, x: :body_mass_g, y: :flipper_length_mm, color: :species)charty = Charty::Plotter.new(:gruff)#<Charty::Plotter:0x000000013d0dab18 @backend=#<Charty::Backends::Gruff:0x000000013efb60a0 @plot=Gruff>>curve = charty.curve do
function {|x| Math.sin(x) }
range x: 0..10, y: -1..1
xlabel 'foo'
ylabel 'bar'
end
curve.render("sample_images/sin.png")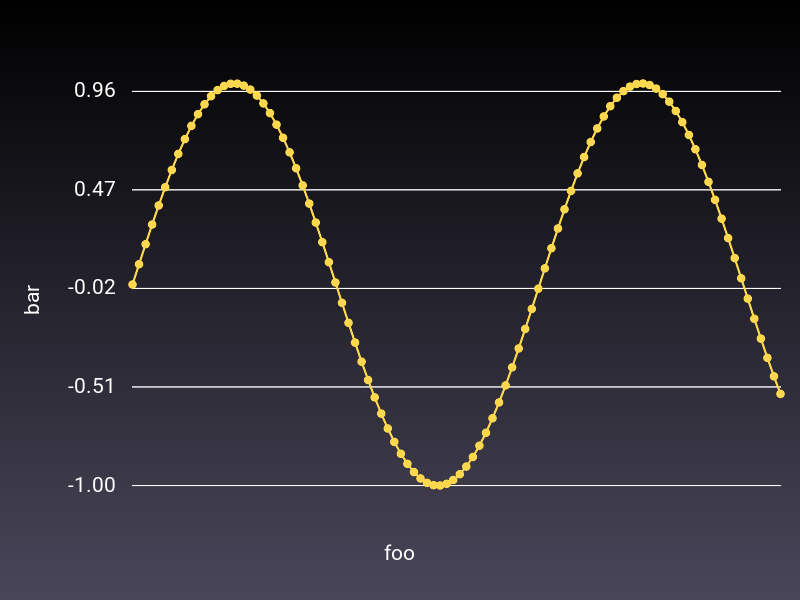
curve = charty.curve do
  function {|x| Math.cos(x) }
  range x: 0..10, y: -1..1
  xlabel 'foo'
  ylabel 'bar'
end
curve.render("sample_images/cos.png")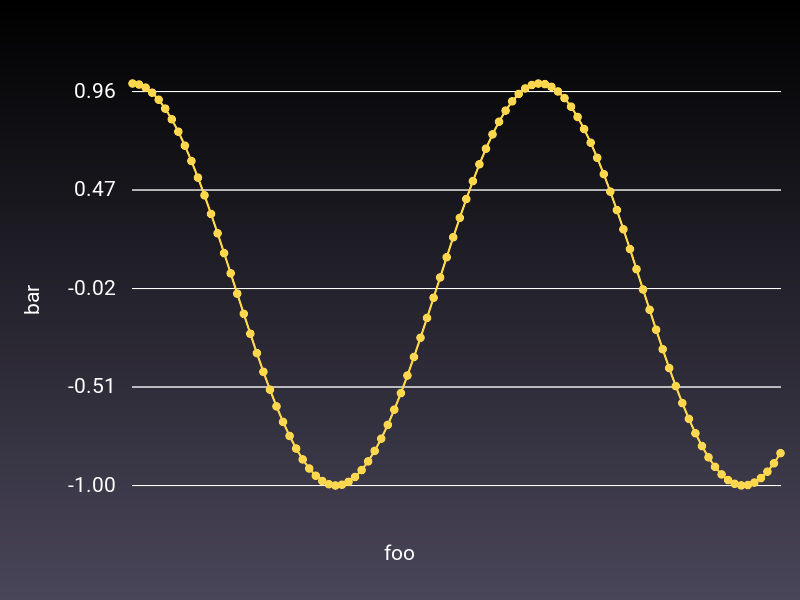
curve = charty.curve do
  function {|x| Math.tan(x) }
  range x: 0..10, y: -1..1
  xlabel 'foo'
  ylabel 'bar'
end
curve.render("sample_images/tan.png")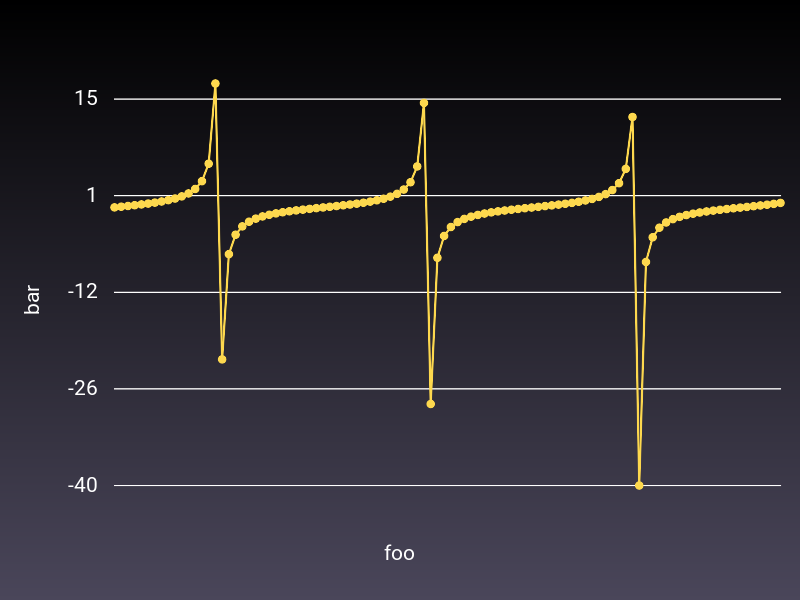
curve = charty.curve do
  function {|x| Math.log(x) }
  range x: 1..10, y: -1..1
  xlabel 'foo'
  ylabel 'bar'
end
curve.render("sample_images/log.png")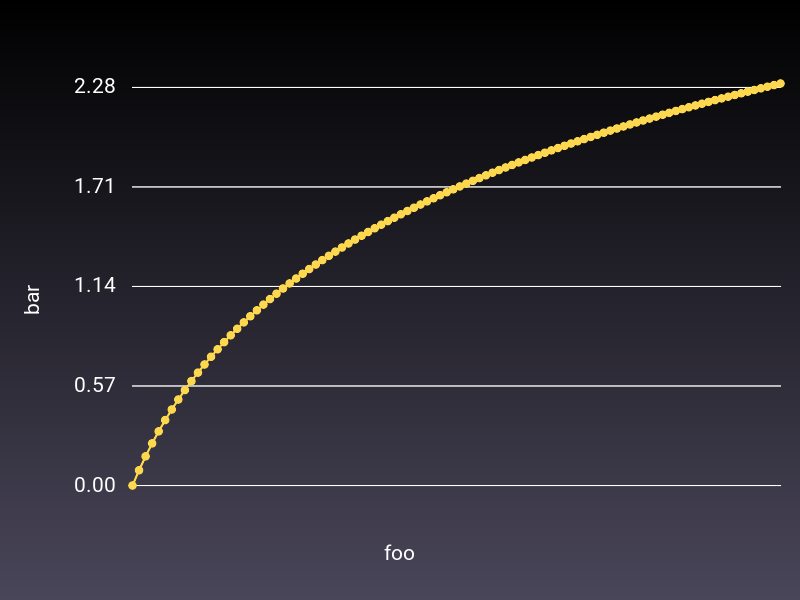
curve = charty.curve do
  function {|x| Math.log2(x) }
  range x: 1..10, y: -1..1
  xlabel 'foo'
  ylabel 'bar'
end
curve.render("sample_images/log2.png")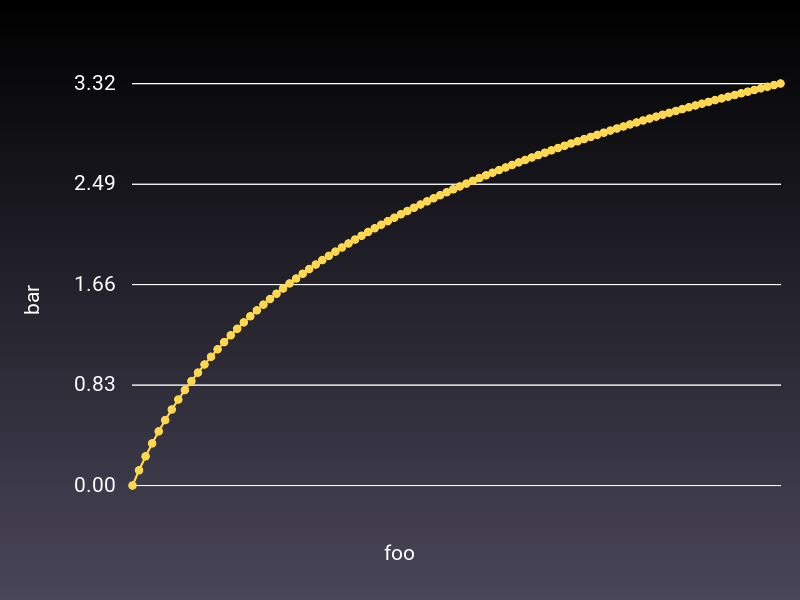
curve = charty.curve do
  function {|x| Math.log10(x) }
  range x: 1..10, y: -1..1
  xlabel 'foo'
  ylabel 'bar'
end
curve.render("sample_images/log10.png")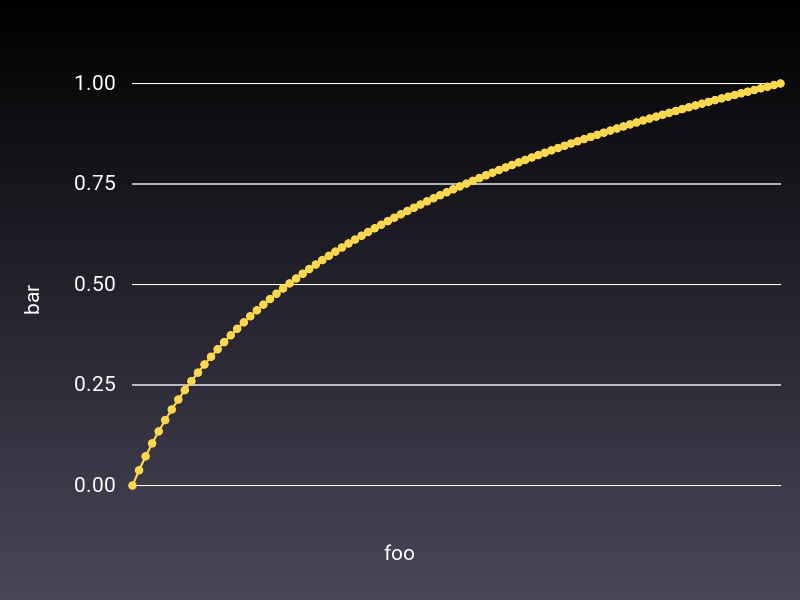
curve = charty.curve do
  function {|x| Math.sqrt(x) }
  range x: 0..10, y: -1..1
  xlabel 'foo'
  ylabel 'bar'
end
curve.render("sample_images/sqrt.png")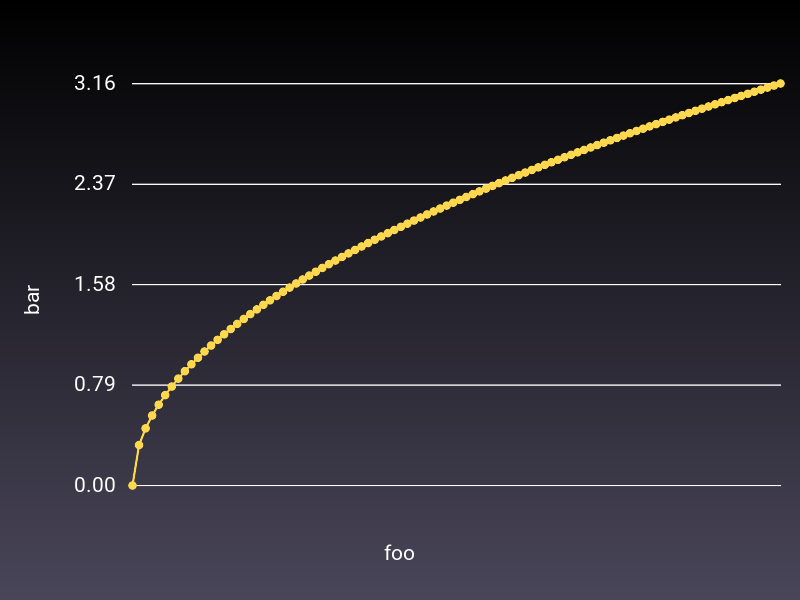
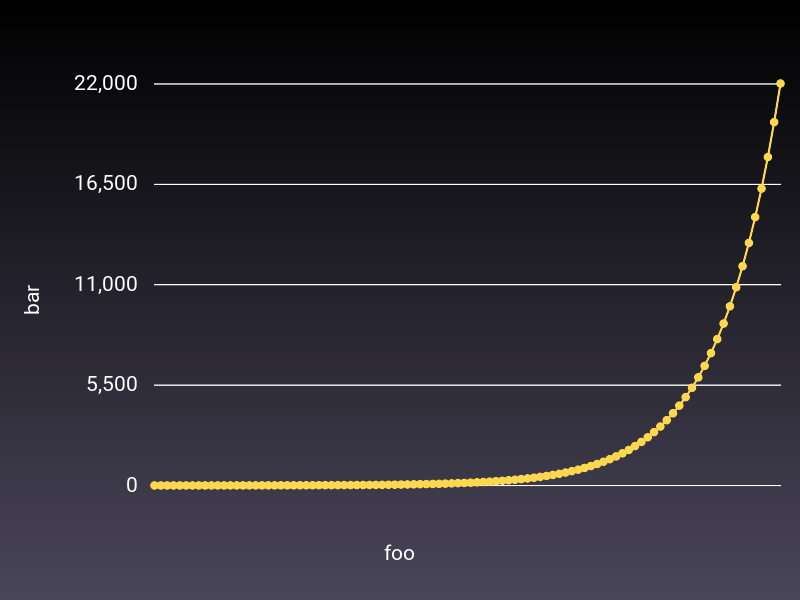
curve = charty.curve do
  function {|x| Math.exp(x) }
  range x: 0..10, y: -1..1
  xlabel 'foo'
  ylabel 'bar'
end
curve.render("sample_images/exp.png")